The measurement of species selection on evolving characters
Simpson, C. 2017. The measurement of species selection on evolving characters. bioRxiv. http://www.biorxiv.org/content/early/2017/08/15/176438 pdf
Many processes can contribute to macroevolutionary change. This fact is the source of the wide variety of macroevolutionary change across time and taxa as well as the bane of paleobiological research trying to understand how macroevolution works. Here, I present a general framework for understanding the variety of macroevolutionary phenomena. Based on Price’s theorem, this framework provides a simple quantitative means to understand (1) the macroevolutionary processes that are possible and (2) the way those processes interact with each other. The major qualitative features of macroevolution depend first on the number of processes that co-occur and then on the magnitudes and evolutionary directions of those processes. Species selection, the major macroevolutionary process, consists of patterns of differential rates of speciation and extinction. Its macroevolutionary efficacy depends on the presences of sufficient microevolutionary change. Conversely, microevolutionary change is limited in power by the independent evolution of species, and species selection acting across populations of species can amplify or suppress microevolution. Non-trends may result if species selection sufficiently neutralizes microevolution and may yield stable macroevolutionary patterns over many millions of years.
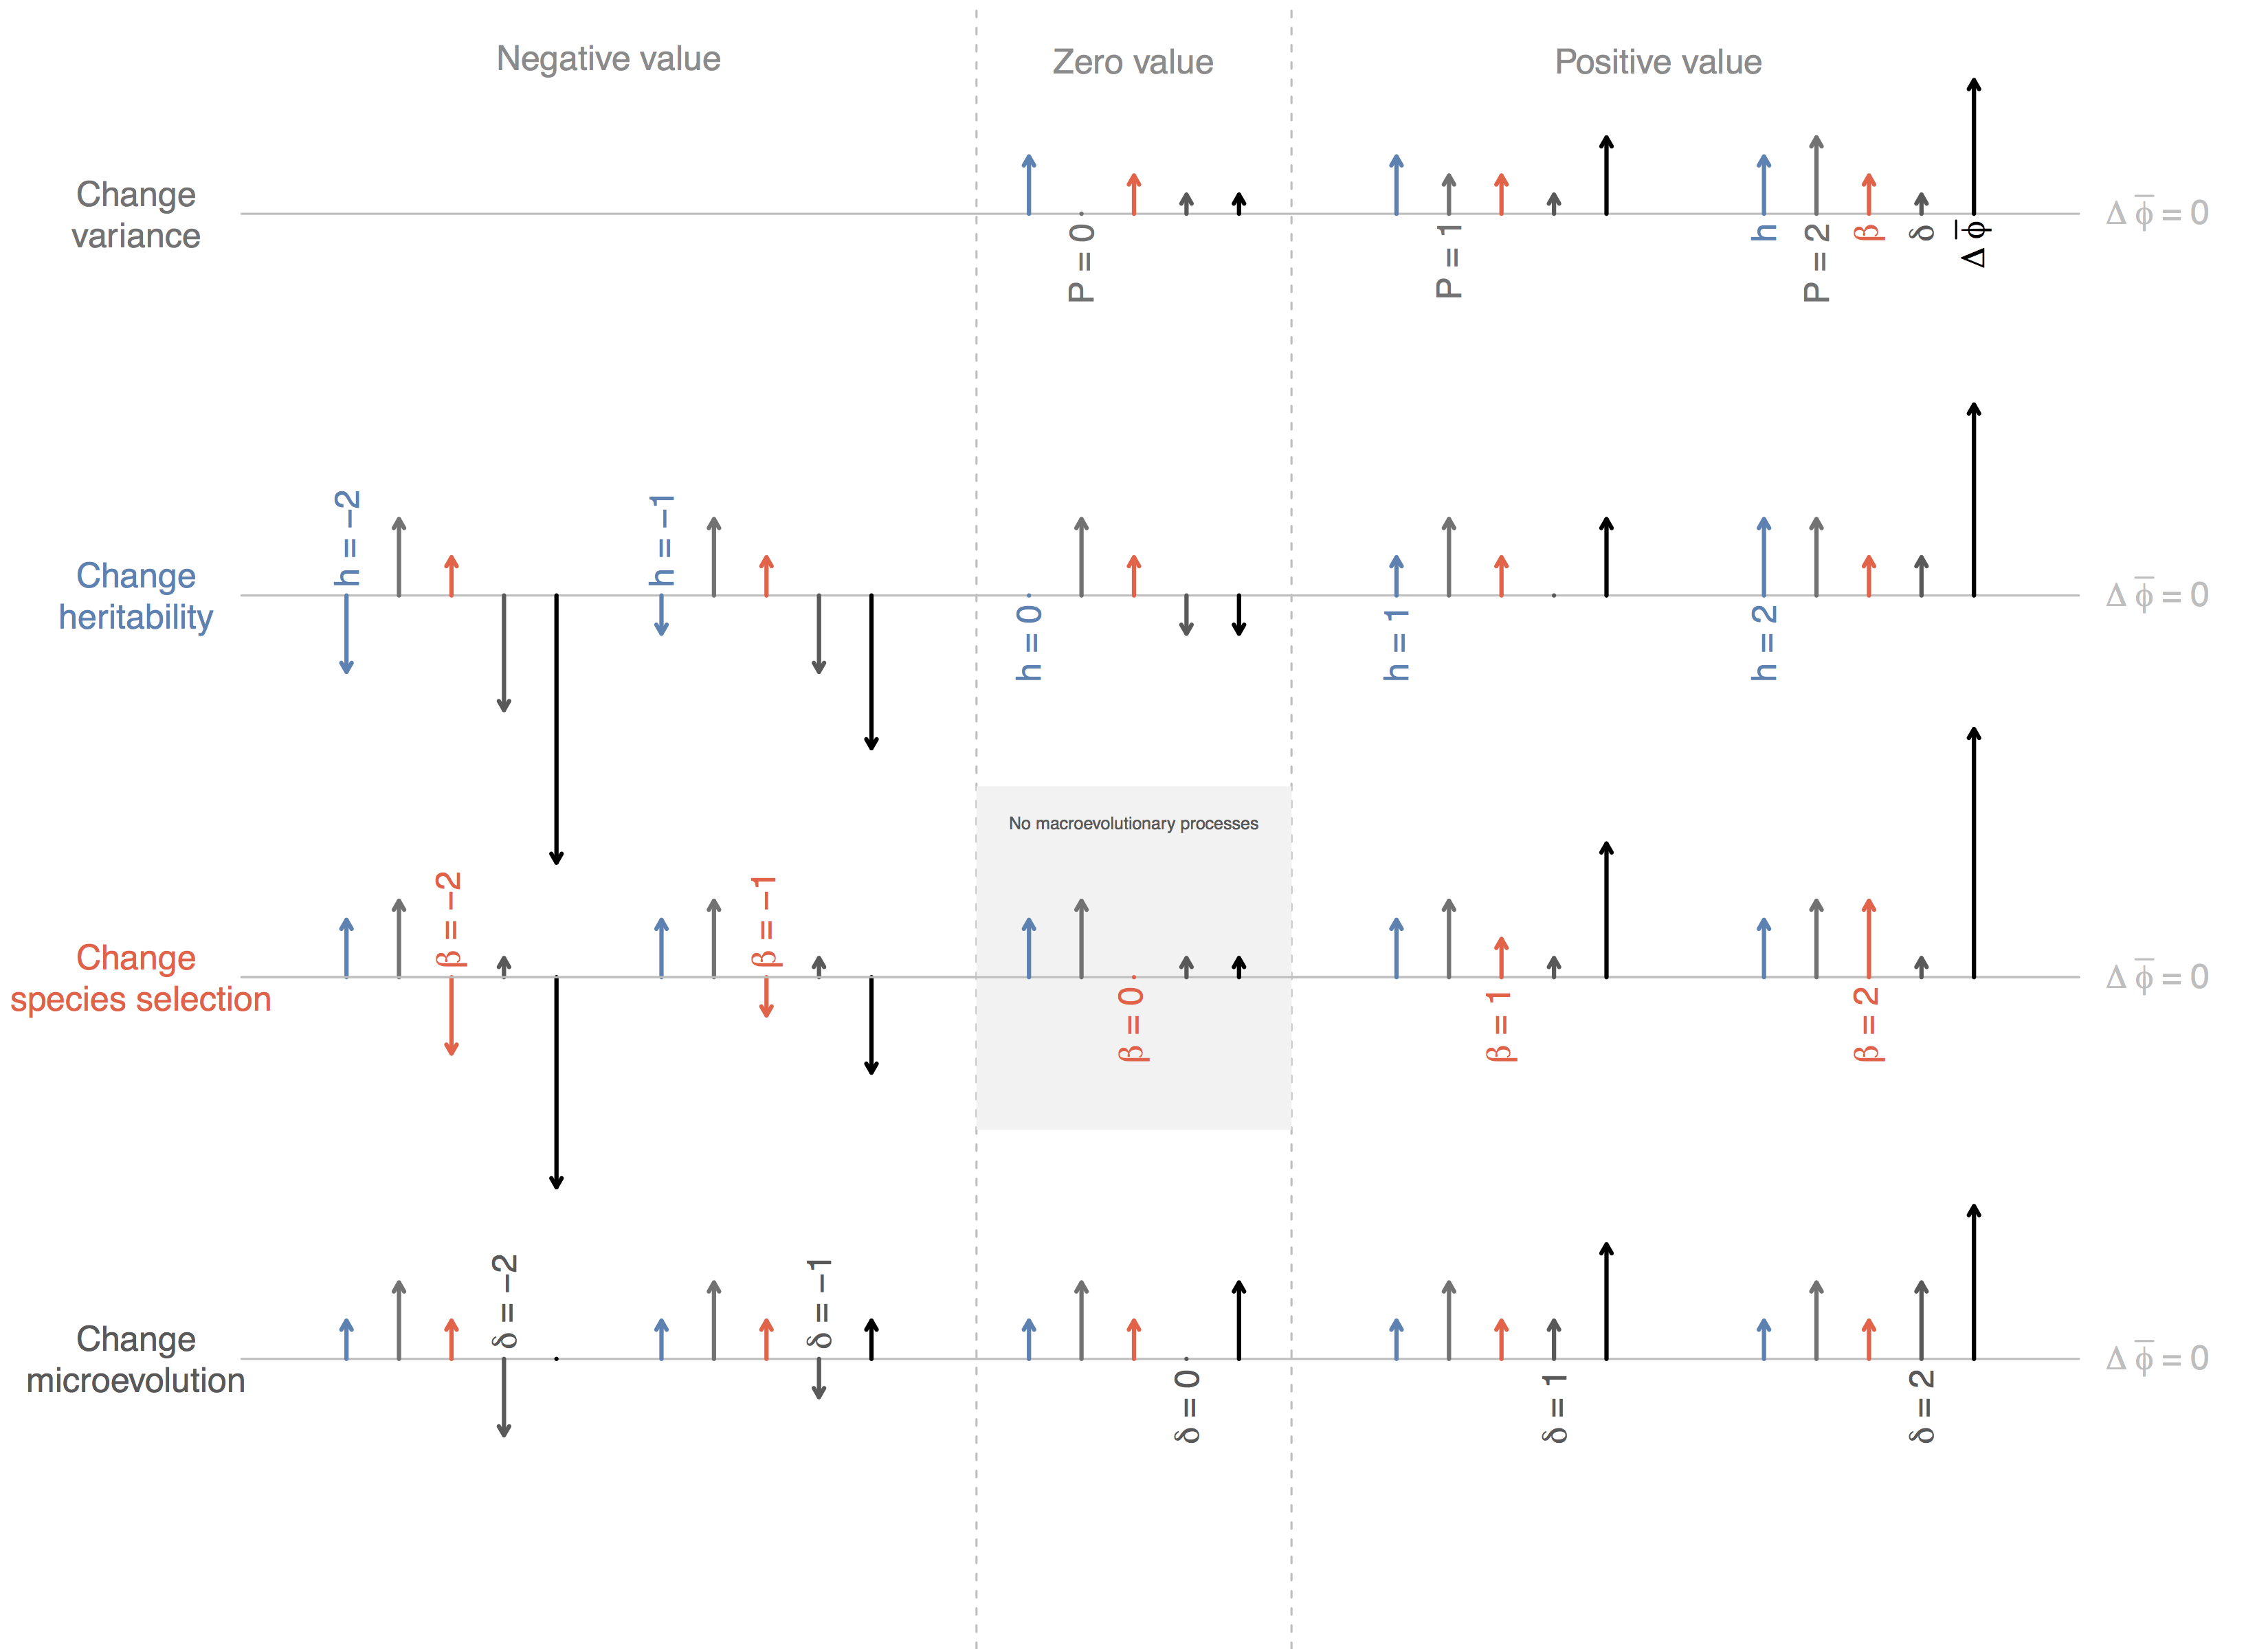
The importance of macroevolutionary and microevolutionary processes on trends is described using visual vector fields. Each row shows the effect on a trend of varying a single species-level parameter. The magnitude and direction of that parameter changes horizontally, from strongly negative on the far left, weakly negative on the middle left, a value of zero in the center, weakly positive on the middle right, and strongly positive on the far right. Each horizontal line defines a trend of zero net change. Vectors that point up are positive and those that point down are negative. In the top row, species-level variance can not be negative, so trends are not possible in that left region. The central grey rectangle shows the only parameter combination here without species selection. In this case, the trend is solely generated by the average pattern of anagenesis and cladogenesis and is independent of the amount of species-level phenotypic variation within the clade at any one time.